A tour of TallyMint Reports
The Reports view has six tabs, and each one answers a single question about your money. This tour tells you which report to reach for and what to look at once you are there. Every report has date-range presets (last 30 days, year to date, last year, and more) and a download icon that exports the numbers to CSV for a spreadsheet.
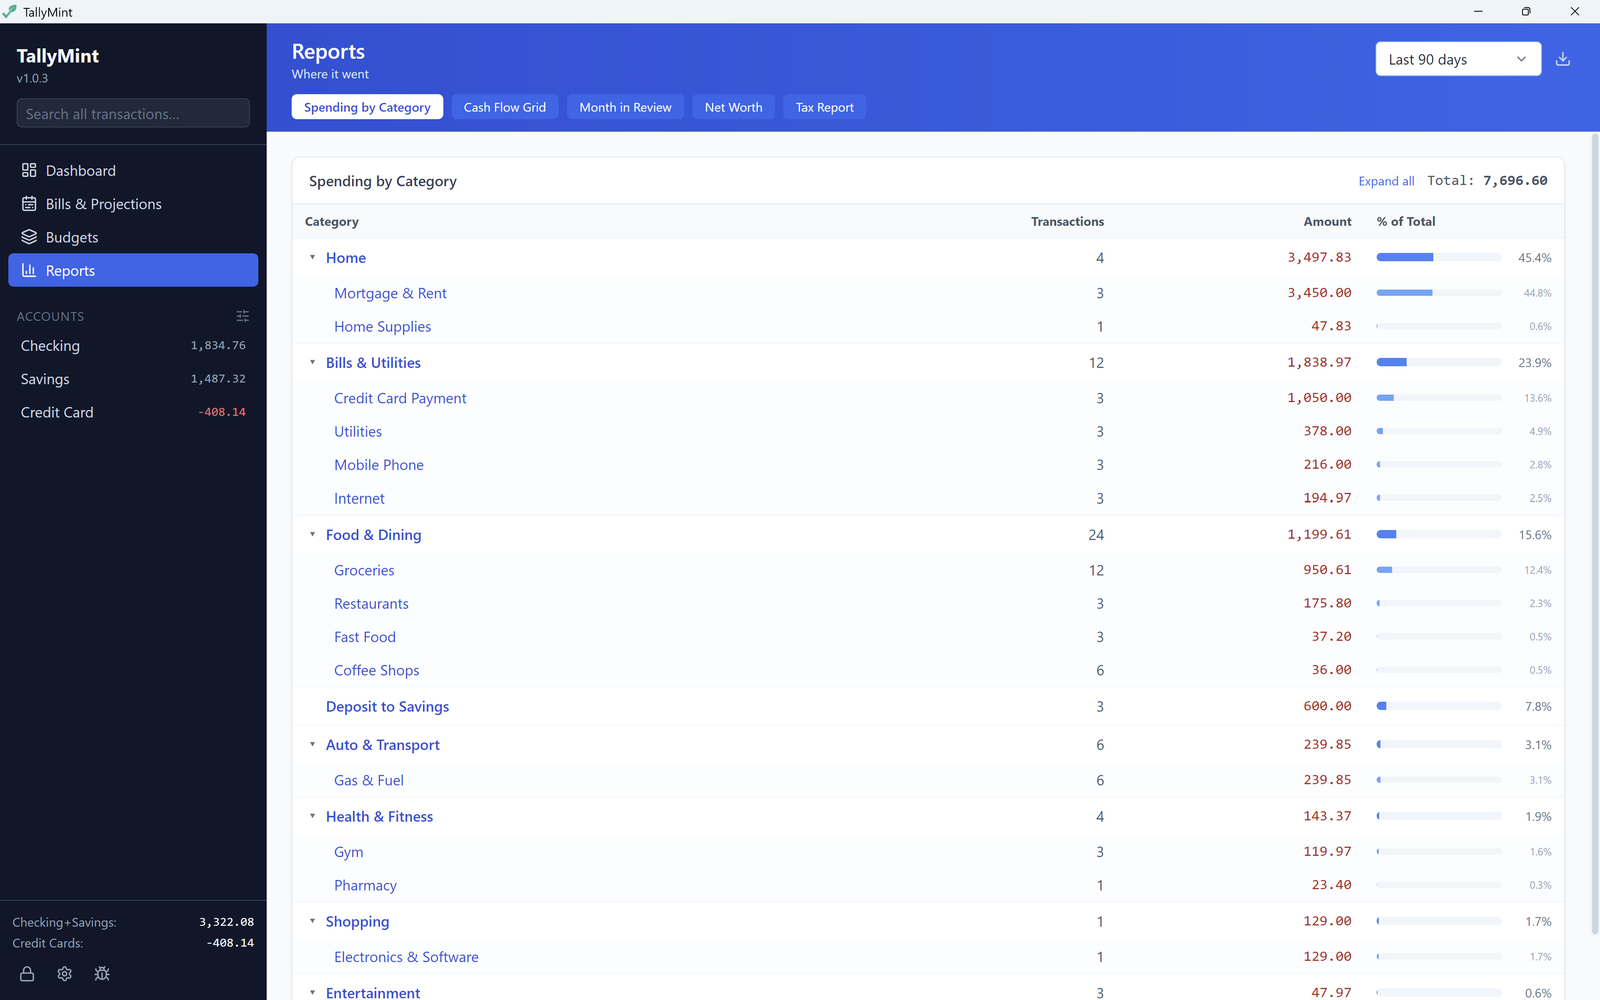
Spending by Category: where did it go?
Your spending for the chosen range, grouped by category with sub-categories rolled up into their parents. Expand a group to see the breakdown, and hover a row to focus it in the chart. This is the report for "why was this month expensive," and it is where the Dashboard's spending card lands when you click a category there.
Cash Flow Grid: how do months compare?
Categories down the side, months across the top, income section and expense section, with row and column totals. This is the classic year-at-a-glance grid: scan across a row to see a category's rhythm (insurance twice a year, a creeping grocery bill), and down a column for that month's whole story. Totals tie to the other reports to the cent.
Month in Review: one month's digest
Pick a month and get its summary: income vs expenses, the categories that moved most, and how the month compares to your recent average. Good habit: open it once a month, the way you would have skimmed a paper statement. Clicking a bar in the Dashboard's cash-flow card opens that month here.
Net Worth: what do you own vs owe?
All accounts on one timeline: assets (checking, savings, investments) against liabilities (credit cards, loans), with the difference as your net worth. This is the long-game chart; spending wiggles matter less than the direction of this line.
Tax Report: what matters in April?
Totals for the categories marked tax-relevant. TallyMint flags the usual ones out of the box (mortgage interest, property tax, charity, and the medical ones), and you can mark or unmark any category yourself: open Settings > Categories, click the pencil on a category, and tick Tax relevant. Marking is per category rather than per branch, so flag exactly the ones you want counted. A QIF import brings these markings with it: a file that marks a category as tax related ticks the box on your matching category, and it can only add a marking, never clear one you set. Export the CSV and tax prep starts from real numbers instead of a shoebox.
Investments: gains and income
Realized capital gains split short-term vs long-term, plus investment income including reinvested dividends, for the chosen range. Built for investment accounts and imported Quicken investment history. Besides CSV, this report exports realized gains as a TXF file that imports directly into TurboTax Desktop and H&R Block Desktop, so tax season starts from your real numbers. Your broker's 1099-B remains the authoritative document; verify against it before filing.
Getting good numbers
- Reports are only as good as categorization. TallyMint's payee rules learn your renames and categories as you go, so the effort fades quickly.
- Transfers between your own accounts never count as income or spending, so paying a credit card does not double-count.
- Errors are shown as errors; an empty report tells you why it is empty and what would fill it.